
In statistics, understanding how data is spread out is just as important as understanding its average. One of the most effective tools for measuring this spread is variance. Whether you’re analyzing exam scores, sales data, or scientific results, variance gives valuable insights into consistency and fluctuation. This article explains how to compute variance, why it matters, and how to apply it in real-world situations.
What is Variance?
Before learning how to compute variance, it’s essential to understand what it represents. Variance is a numerical value that tells you how far each number in a dataset is from the mean and consequently from every other number.
If the values vary widely, the variance will be large. It’s a fundamental concept in descriptive statistics and is a stepping stone to more advanced analyses.
Why Variance is Important
Learning how to compute variance isn’t just a mathematical exercise. It’s a skill used in many disciplines:
- Finance: To evaluate the volatility of stocks or returns.
- Education: To assess the spread of student performance.
- Science: To check consistency in experiments.
- Manufacturing: To maintain product quality by reducing variation.
Variance helps decision-makers understand whether data is consistent or unpredictable, helping them make more informed choices.
See also: How Online Learning Is Changing the Education Landscape
The Core Idea Behind Variance
At its heart, variance is about comparing each data point to the average. By squaring the differences, we ensure that all deviations are treated as positive (since some values will be above and some below the mean). Then we average those squared differences.
This method gives us a value that reflects the overall deviation in the dataset.
Key Components in the Calculation
Before diving into the actual formula, let’s break down what we need:
- Mean (Average): The central value of the dataset.
- Squared Deviations: Each deviation is squared to eliminate negative values.
- Sum and Divide: Add up all squared deviations and divide by the number of data points (for population) or by (n – 1) for a sample.
Population vs. Sample Variance
There are two types of variance depending on the data you have:
- Population Variance: When you have access to the entire dataset.
- Sample Variance: When you’re working with a subset or sample from a larger population.
Each has a slightly different formula:
Population Variance (σ²):
σ2=1N∑i=1N(xi−μ)2\sigma^2 = \frac{1}{N} \sum_{i=1}^{N}(x_i – \mu)^2
Sample Variance (s²):
s2=1n−1∑i=1n(xi−xˉ)2s^2 = \frac{1}{n – 1} \sum_{i=1}^{n}(x_i – \bar{x})^2
In both cases:
- xix_i = individual data point
- μ\mu or xˉ\bar{x} = mean of the data
The sample variance uses n−1n – 1 instead of nn to correct bias in estimating the population variance. This is known as Bessel’s correction.
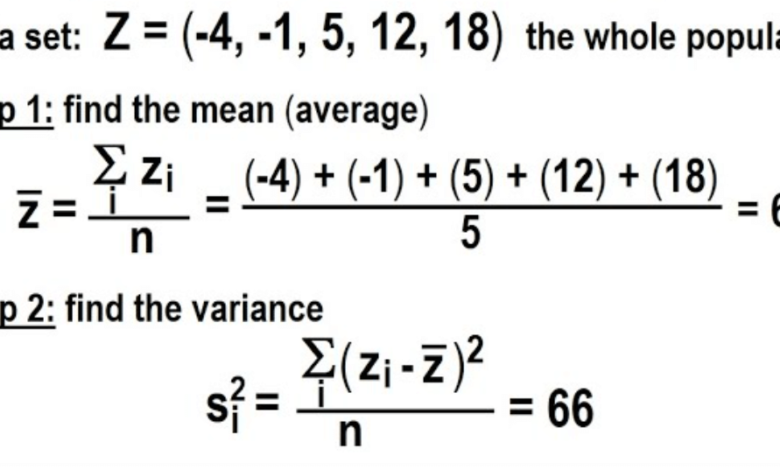
Step-by-Step Example
Let’s walk through how to compute variance using a sample dataset:
Dataset: 4, 7, 9, 10, 12
Step 1: Find the Mean
Mean=4+7+9+10+125=425=8.4\text{Mean} = \frac{4 + 7 + 9 + 10 + 12}{5} = \frac{42}{5} = 8.4
Step 2: Find Each Dev#iation from the Mean
- 4 – 8.4 = -4.4
- 7 – 8.4 = -1.4
- 9 – 8.4 = 0.6
- 10 – 8.4 = 1.6
- 12 – 8.4 = 3.6
Step 3: Square Each Deviation
- (-4.4)² = 19.36
- (-1.4)² = 1.96
- (0.6)² = 0.36
- (1.6)² = 2.56
- (3.6)² = 12.96
Step 4: Add the Squared Deviations
19.36+1.96+0.36+2.56+12.96=37.219.36 + 1.96 + 0.36 + 2.56 + 12.96 = 37.2
Sample Variance=37.24=9.3\text{Sample Variance} = \frac{37.2}{4} = 9.3
So, the sample variance is 9.3.
Tools to Compute Variance
While manual calculation is important for understanding, there are various tools that can compute variance automatically:
1. Microsoft Excel:
Use the formula:
- =VAR.S(range) for sample variance
- =VAR.P(range) for population variance
2. Python (with NumPy):
import numpy as np
data = [4, 7, 9, 10, 12]
print(np.var(data)) # Population variance
print(np.var(data, ddof=1)) # Sample variance
3. Statistical Calculators:
Many websites offer free variance calculators. Simply input your dataset, and they compute both the sample and population variances.
Practical Applications
Knowing how to compute variance opens up opportunities for real-world problem-solving:
In Finance:
Investors compute variance to determine how much an investment’s return varies. A higher variance suggests more risk.
In Sports:
Coaches analyze performance variance to identify players who are inconsistent and those who perform reliably.
In Healthcare:
Doctors and researchers study variance in treatment outcomes to determine effectiveness and tailor medical decisions.
In Education:
Variance helps evaluate the spread of student performance, identifying learning gaps and informing teaching strategies.
Common Mistakes to Avoid
When computing variance, avoid these pitfalls:
- Not distinguishing between sample and population formulas.
- Forgetting to square the deviations.
- Failing to subtract the mean accurately.
- Using the wrong number of data points for the divisor.
Double-checking each step ensures accurate results.
Variance vs. Other Statistical Measures
- Mean: Central value of the data.
- Median: Middle value when data is ordered.
- Mode: Most frequent value.
- Standard Deviation: The square root of variance, easier to interpret in the same unit as the data.
Final Thoughts
Understanding how to compute variance equips you with a powerful skill in data analysis. Whether you’re a student, researcher, analyst, or business owner, knowing the degree of variation in your data is essential for making informed decisions. Variance doesn’t just explain how different your numbers are—it gives insight into consistency, predictability, and risk.
By mastering this foundational concept, you’re well on your way to deeper statistical analysis, whether in academic work or real-world scenarios.